Thermographic Analysis
Description
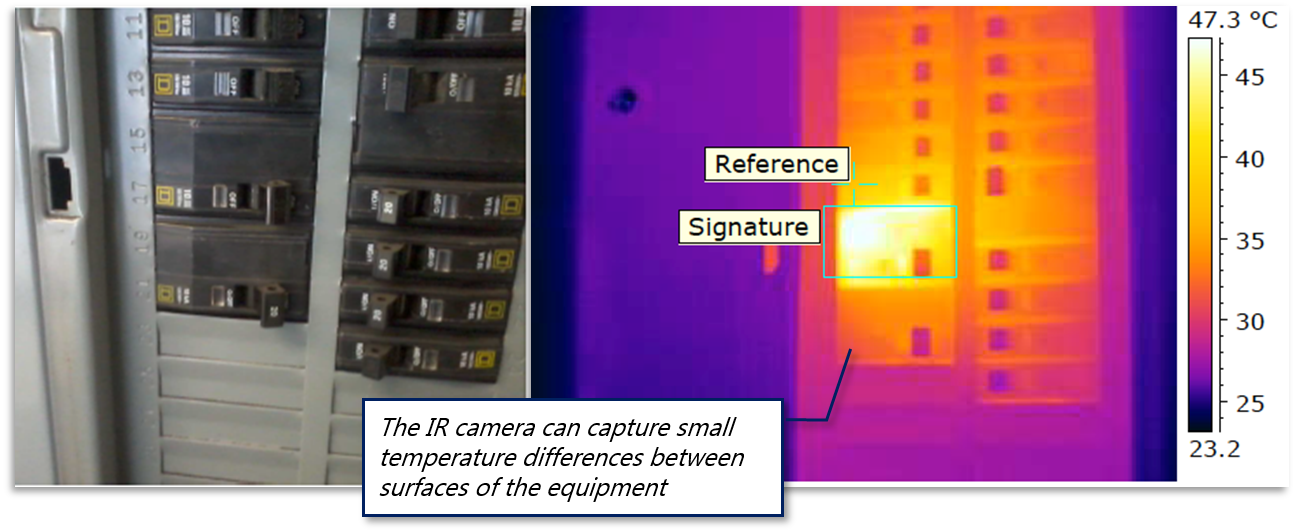
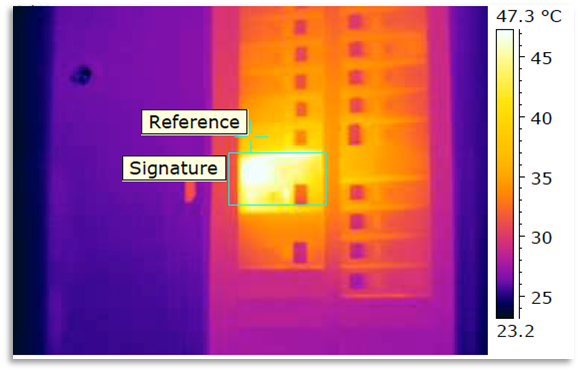
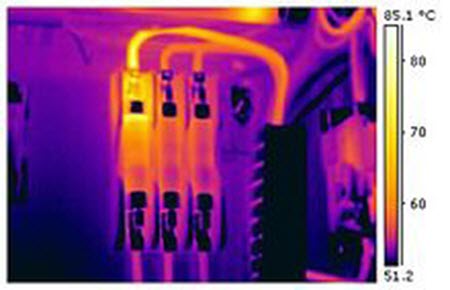
Thermography enables you to visually identify, evaluate, and show energy loss or excess consumption in a facility or equipment.
- Leaking insulation on pipes or ductwork
- Energy loss around building envelope
- Infiltration/exfiltration
- Overloaded electrical cables/wiring
- Overheating motors
Pic 1
Pic 2
Pic 3
| Fault Type | Description | Typical Repair Cost Savings | Typical Energy Cost Savings |
|---|---|---|---|
| Minor | 1 – 9 ° F above the norm | $500 | $0.15 per fault per day |
| Intermediate | 10 – 34 ° F above the norm | $500 | $0.40 per fault per day |
| Serious | 34 to 75° F above the norm | $3,000 | $0.75 per fault per day |
| Critical | ≥ 75° F above the norm | $3,000 | $0.75 per fault per day |